Closed-Loop Remediation: Eliminating Human Latency in Self-Healing Systems
Understanding AI powered Closed-Loop Remediation, Eliminating Human Latency in Self-Healing Systems with a SRE usecase.

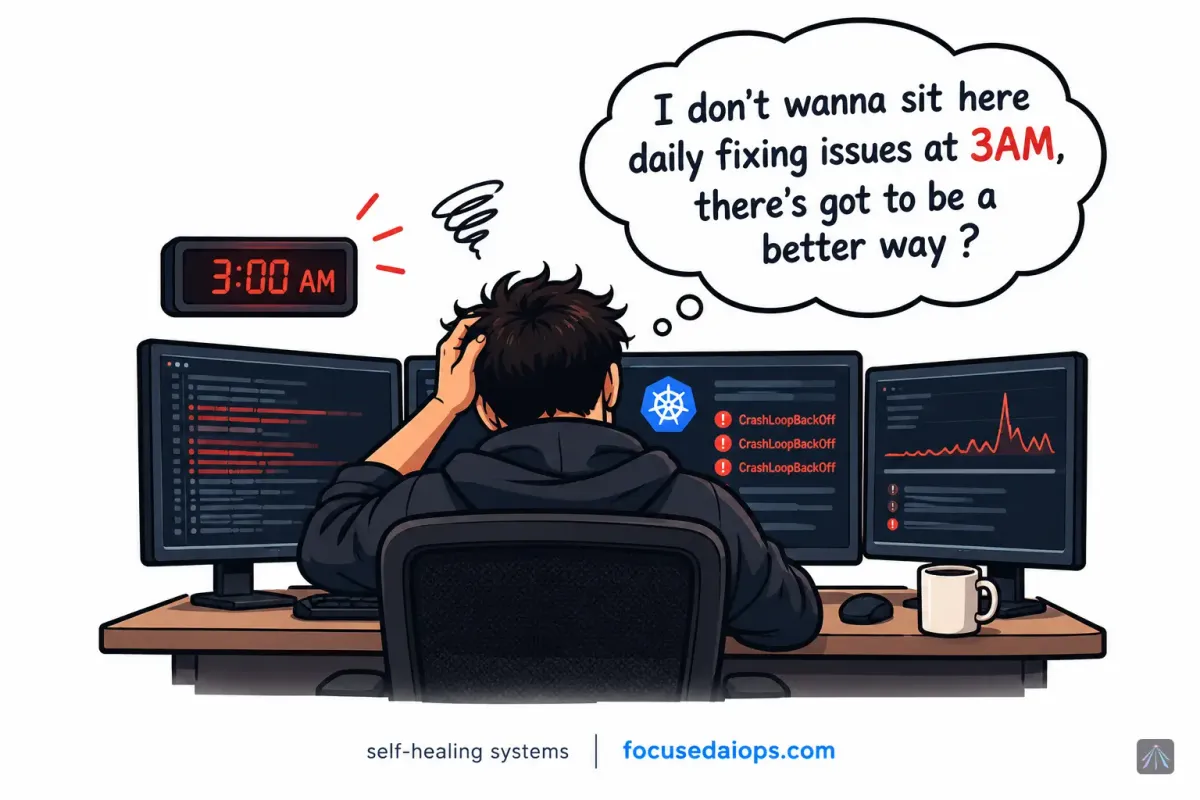
Traditional incident response depends on humans to detect failures, diagnose root causes, execute fixes, and verify recovery. Even with centralized observability and automated alerting, the remediation process often remains manual.
Closed-loop remediation turns incident response into an automated control loop: detect → diagnose → remediate → verify.
Instead of waiting for an engineer to respond to an alert, an AIOps system uses telemetry, predefined remediation policies, and infrastructure APIs to resolve known failure patterns automatically.
What Is Closed-Loop Remediation?
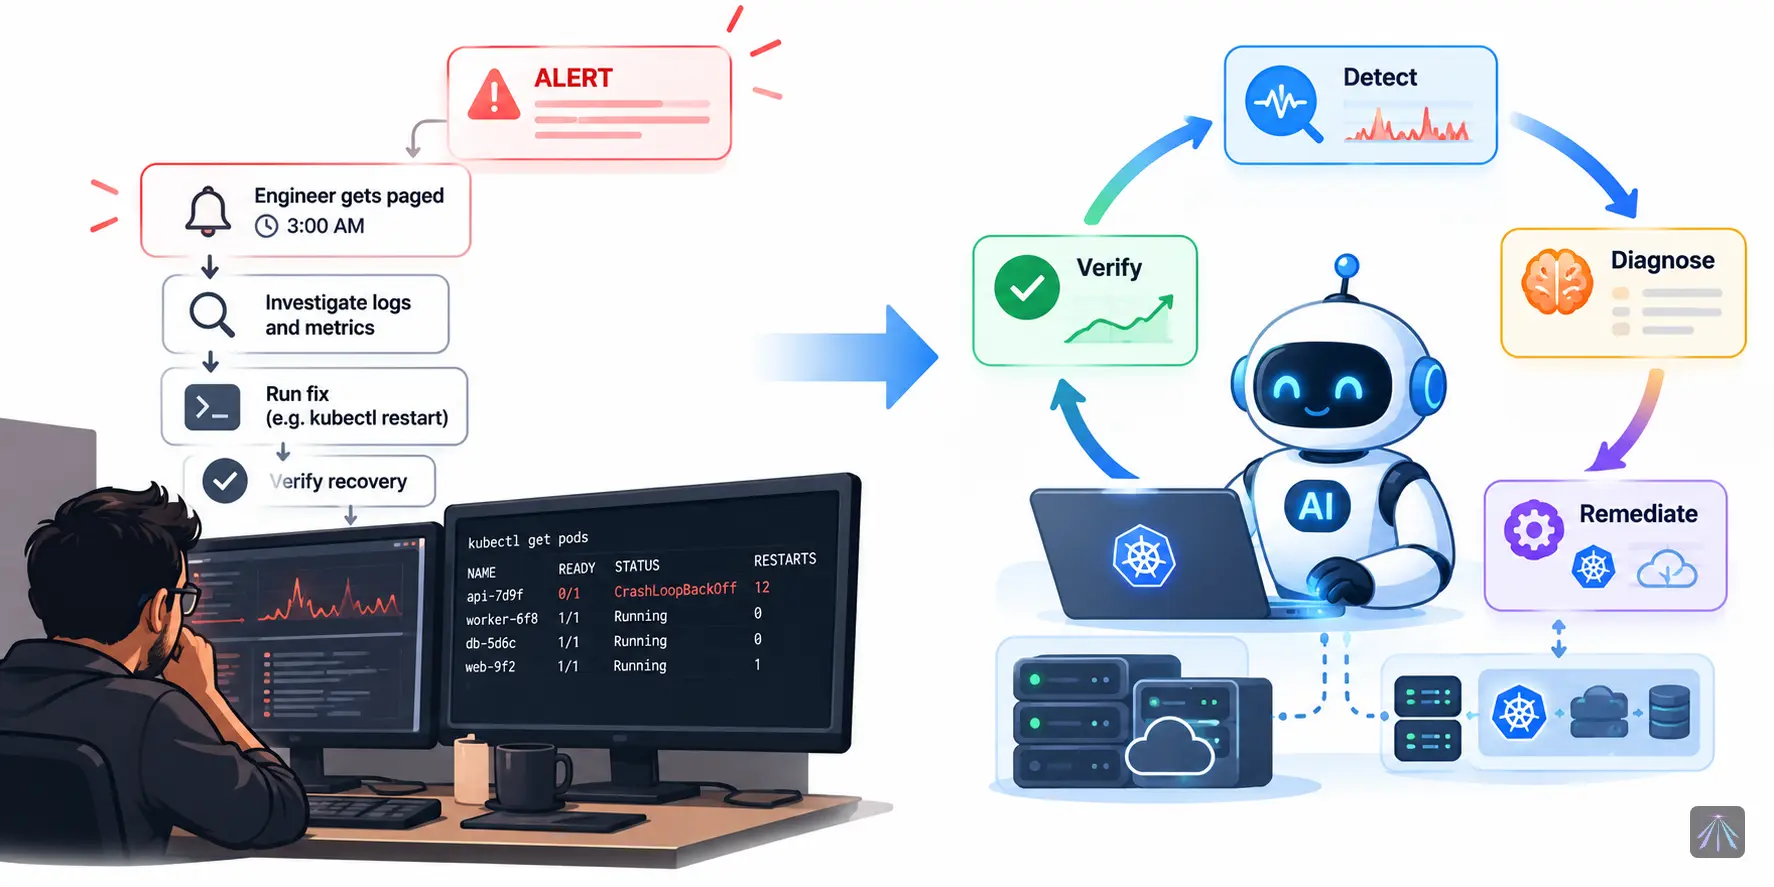
Closed-loop remediation is an automated operational process in which a system observes its current state, compares it against expected conditions, applies corrective actions, and evaluates the resulting state.
The loop consists of four stages:
- Detection: Identify an operational anomaly using metrics, logs, traces, events, or health checks.
- Diagnosis: Determine the likely failure mechanism and match it to an approved remediation policy.
- Execution: Apply a corrective action through an infrastructure, orchestration, or application API.
- Verification: Confirm that the system has recovered and that the corrective action has not introduced additional problems.
If verification fails, the controller can retry within predefined limits, execute a rollback, escalate to an engineer, or disable further automated actions.
The defining characteristic is feedback. An action is not considered successful simply because an API returned HTTP 200. The system must verify that the desired operational state has actually been restored.
Architecture of a Closed-Loop Remediation System
A production implementation typically combines observability, event processing, decision logic, remediation execution, and post-action verification.
Reference architecture:
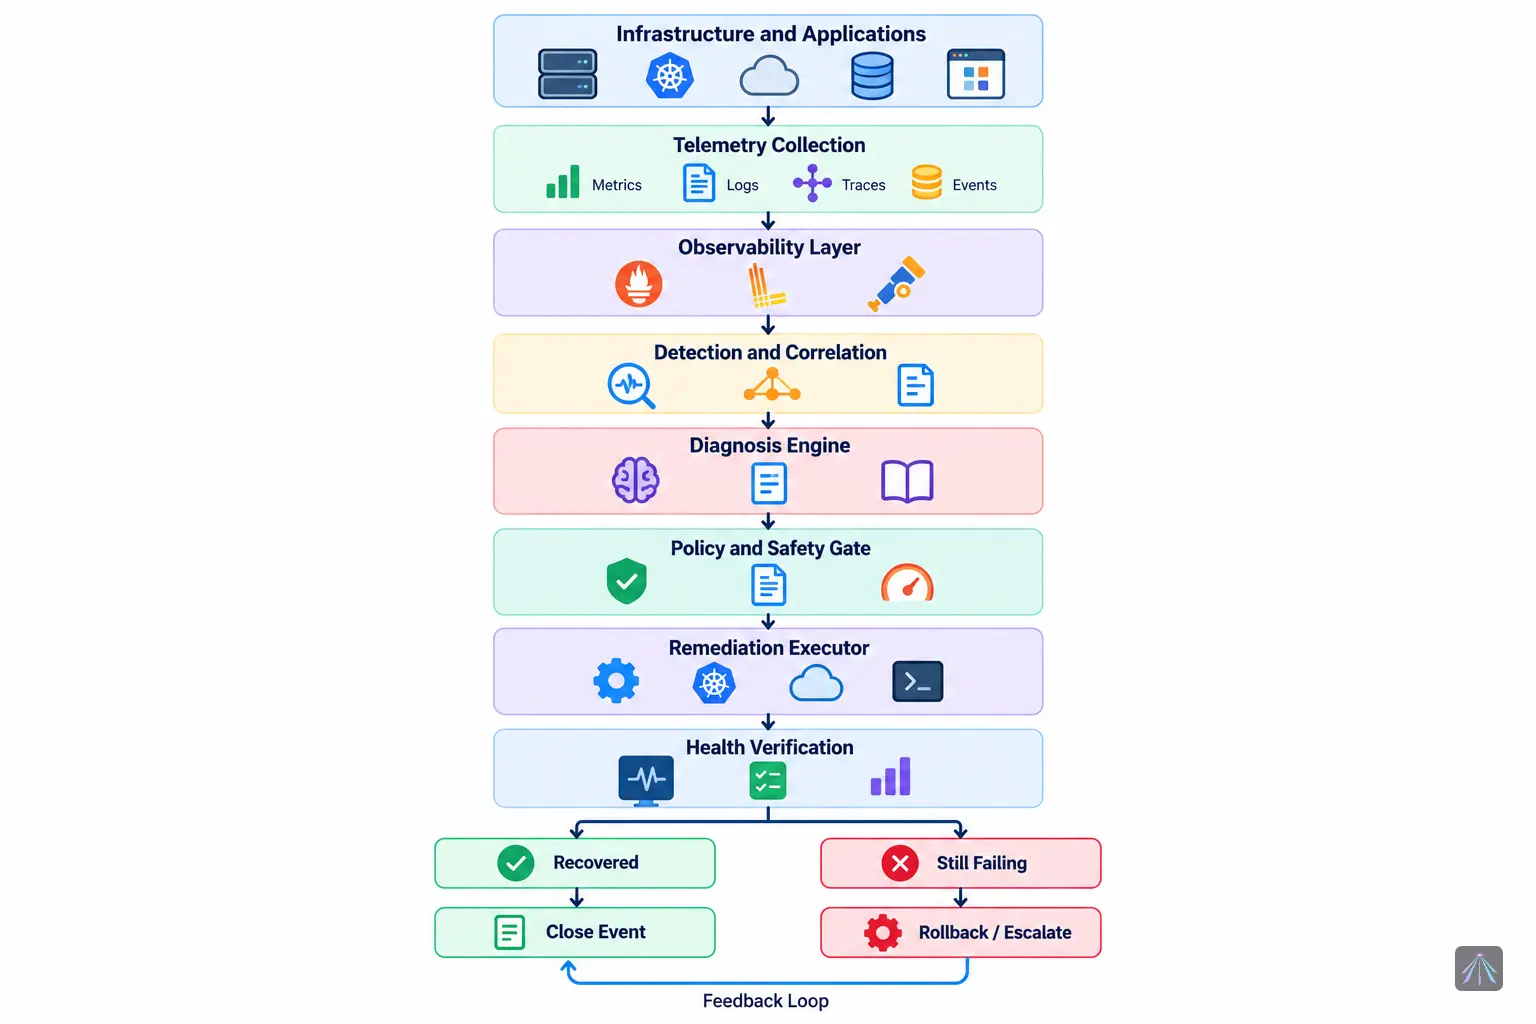
Each component has a distinct responsibility.
Telemetry collection
The system collects operational signals from infrastructure and applications.
Typical inputs include:
- CPU and memory utilization.
- Container restarts and Kubernetes events.
- Application error rates and request latency.
- HTTP health-check responses.
- Database connection pools and query latency.
- Queue depth and consumer lag.
- Deployment events and configuration changes.
- Distributed traces showing latency or failure propagation.
OpenTelemetry can provide instrumentation and telemetry collection, Prometheus can handle metrics and alert evaluation, and Loki can store and query logs. Grafana can provide dashboards and incident visibility.
These components supply the evidence required for automated decisions. They do not, by themselves, constitute a complete remediation controller.
Detection and event correlation
Detection identifies a deviation from expected behavior.
Examples include:
- A container repeatedly entering
CrashLoopBackOff(a status message in Kubernetes indicating that a container in a Pod is repeatedly starting, crashing, and restarting in an infinite loop). - An increase in HTTP 5xx responses.
- Memory consumption approaching the container limit.
- A queue's consumer lag exceeding its operational threshold.
- A database connection pool reaching saturation.
- A service violating its latency SLO.
Detection can use static thresholds, rate-of-change rules, anomaly detection, or correlated events.
For example, a container restart alone may not justify remediation. However, repeated restarts combined with OOMKilled (its a container termination status) events, increasing memory consumption, and a recent deployment provide stronger evidence of a specific failure pattern.
Event correlation reduces the risk of treating every alert as an independent incident.
Diagnosis and remediation selection
The diagnosis engine evaluates the event context and selects an approved response.
Inputs may include:
- Current metrics and recent telemetry.
- Application and infrastructure logs.
- Kubernetes pod status and events.
- Recent deployment history.
- Service dependencies.
- Known incident signatures.
- Historical remediation outcomes.
- Existing runbooks and policy definitions.
Note: A runbook is a compiled, step-by-step operational guide or instruction manual used by developers, SREs (Site Reliability Engineers), and system administrators
A deterministic rule engine is often sufficient for known failure patterns. Machine learning can help identify anomalies and correlate signals across services. An LLM-based agent can assist with log summarization, runbook selection, or generating a proposed diagnosis.
These mechanisms should not have unrestricted authority to execute infrastructure changes.
For critical systems, the selected remediation should match a version-controlled policy with explicit preconditions, permissions, execution limits, and verification criteria.
Remediation execution
The executor performs the approved action using the relevant control-plane API.
Examples include:
- Restarting a failed workload.
- Rolling back a defective deployment.
- Scaling a deployment within predefined limits.
- Removing an unhealthy instance from service.
- Restarting a worker that has stopped processing messages.
- Triggering a controlled failover.
- Disabling a faulty scheduled job.
Execution should be idempotent where possible, meaning repeated requests do not produce unintended additional effects.
The executor should also implement timeouts, bounded retries, concurrency limits, audit logging, and protection against duplicate events.
Verification and feedback
After execution, the system evaluates whether the service has returned to an acceptable state.
Verification may include:
- Pod readiness and restart counts.
- Application health-check responses.
- HTTP 5xx rates.
- Request latency percentiles.
- Resource utilization.
- Queue processing rates.
- Database connection availability.
- SLO compliance over an observation window.
The observation window should be long enough to detect recurring failures rather than just a momentary improvement.
For example, a restarted pod may initially become healthy but crash again after receiving production traffic. Checking readiness alone would miss this recurrence.
If the service remains unhealthy, the system should stop uncontrolled retries and transition to a defined fallback: rollback, escalation, or manual intervention.
Example: Automatically Recovering a Kubernetes Workload
Consider a Kubernetes deployment experiencing memory-related failures.
The application gradually consumes memory until its container reaches its configured memory limit. Kubernetes terminates the container, and the pod enters a repeated restart cycle.
In a manual workflow, an engineer receives an alert, inspects the pod, reviews logs, investigates memory usage, and decides whether to restart the workload, roll back a deployment, or modify its resource configuration.
A closed-loop remediation system can automate the response to a known failure pattern.
Step 1: Detect the failure
Prometheus detects an increase in container restarts. Kubernetes reports an OOMKilled termination reason.
The detection engine correlates:
- Repeated container restarts.
- Memory utilization approaching the configured limit.
OOMKilledtermination events.- A recent application deployment, if present.
The combined evidence triggers the relevant remediation policy.
Step 2: Validate the diagnosis
The diagnosis engine retrieves the pod's status, recent events, deployment history, and application telemetry.
It determines whether the incident matches a known memory-failure signature.
Before acting, it checks:
- Whether the workload is managed by a supported controller.
- Whether the issue affects one replica or the entire deployment.
- Whether a recent deployment is a plausible trigger.
- Whether the service has sufficient healthy replicas.
- Whether the proposed action is permitted by policy.
A restart is not automatically the correct response to every memory-related incident. If the workload has a persistent memory leak, restarting it may provide only temporary relief.
Step 3: Execute the remediation
The system selects an action based on the diagnosed failure.
Option A: Restart a recoverable workload
If the failure matches a known transient condition, the executor can delete the affected pod and allow its Kubernetes controller to recreate it.
kubectl delete pod <pod-name> -n <namespace>This command is illustrative. In production, the executor should use an authenticated Kubernetes API client, validate the target, and enforce policy limits rather than running arbitrary shell commands.
Option B: Roll back a defective deployment
If the failure correlates with a recent rollout and the deployment is confirmed to be the likely cause, the system can initiate a controlled rollback.
kubectl rollout undo deployment/<deployment-name> \
  -n <namespace>
The rollback policy should validate the deployment history and confirm that the previous revision is an approved recovery target.
Option C: Scale within approved limits
If the issue is capacity-related rather than a memory leak, the system may increase replicas or adjust resources within predefined limits.
Scaling replicas can increase application capacity, but it does not resolve a per-container memory leak. Increasing memory limits may also be unsafe if the node lacks sufficient capacity.
The diagnosis must therefore determine which corrective action is appropriate.
Step 4: Verify recovery
After executing the action, the controller monitors the deployment.
Example verification criteria:
| Signal | Recovery condition |
|---|---|
| Pod readiness | Required replicas become ready |
| Container restarts | No new unexpected restart during the observation window |
| HTTP 5xx rate | Returns below the configured threshold |
| Request latency | Returns within the service's acceptable range |
| Memory utilization | Remains within the defined operating envelope |
| Service SLO | Returns to the required service level |
If the workload becomes healthy and remains stable, the incident can be marked as remediated.
If the failure persists, the system should stop repeating the same action indefinitely, preserve diagnostic evidence, and escalate the incident.
The objective is verified recovery, not merely successful command execution.
Safety Controls for Autonomous Remediation
Automation that changes production infrastructure requires explicit safety boundaries.
Without them, a remediation system can amplify an incident rather than resolve it.
Least-privilege execution
Use dedicated service accounts with narrowly scoped permissions.
For example, a remediation controller authorized to restart workloads in one namespace should not automatically receive cluster-wide administrative privileges.
Separate permissions for observation, diagnosis, and execution wherever practical.
Precondition validation
Before executing a corrective action, verify that its assumptions still hold.
A policy that permits pod replacement might require:
- The workload is managed by a Deployment or another supported controller.
- The service has sufficient healthy replicas.
- The target is not part of a protected workload.
- No conflicting rollout or maintenance operation is active.
These checks reduce the risk of executing a previously valid action against a changed system state.
Rate limits and circuit breakers
Limit the number of remediation attempts per workload and time window.
For example, if a pod repeatedly crashes after replacement, the controller should stop restarting it and escalate.
Circuit breakers are especially important when multiple services share dependencies. Repeatedly restarting dependent services during a database outage can increase load and delay recovery.
Approval boundaries
Not every action should be autonomous.
A useful policy model separates actions into three classes:
- Low risk: Retry a failed health check, restart an approved stateless worker, or clear a recoverable processing backlog.
- Moderate risk: Roll back a deployment or scale a service within approved limits.
- High risk: Modify database schemas, delete persistent data, change security policies, or perform irreversible infrastructure operations.
Low-risk actions may be fully automated after validation. Moderate-risk actions may require additional checks or approval. High-risk actions should generally require explicit human authorization and a documented recovery plan.
The appropriate boundary depends on the service's criticality and failure impact.
Auditability and rollback
Record every automated action, including:
- Triggering event and supporting evidence.
- Diagnosis and selected policy.
- Target resources.
- Precondition results.
- API requests and execution outcomes.
- Verification metrics.
- Final incident status.
Policies should be version-controlled, and changes to remediation logic should pass testing before production deployment.
Where possible, actions should have a compensating action or rollback strategy.
The Role of AI Agents in Closed-Loop Remediation
AI agents can make remediation systems more context-aware, but they should not replace deterministic safety controls.
An agent can correlate logs across services, summarize distributed traces, identify likely root causes, retrieve relevant runbooks, and recommend corrective actions.
For example, an agent investigating elevated API latency might correlate:
- An increase in request latency.
- Database connection pool saturation.
- Slow database queries.
- A recent deployment that increased query volume.
It can then propose a remediation based on the evidence and an approved runbook.
However, the system should distinguish between diagnostic intelligence and execution authority.
A practical architecture uses AI for evidence analysis and action selection while a deterministic policy engine validates the proposed action. The executor then performs only authorized operations.
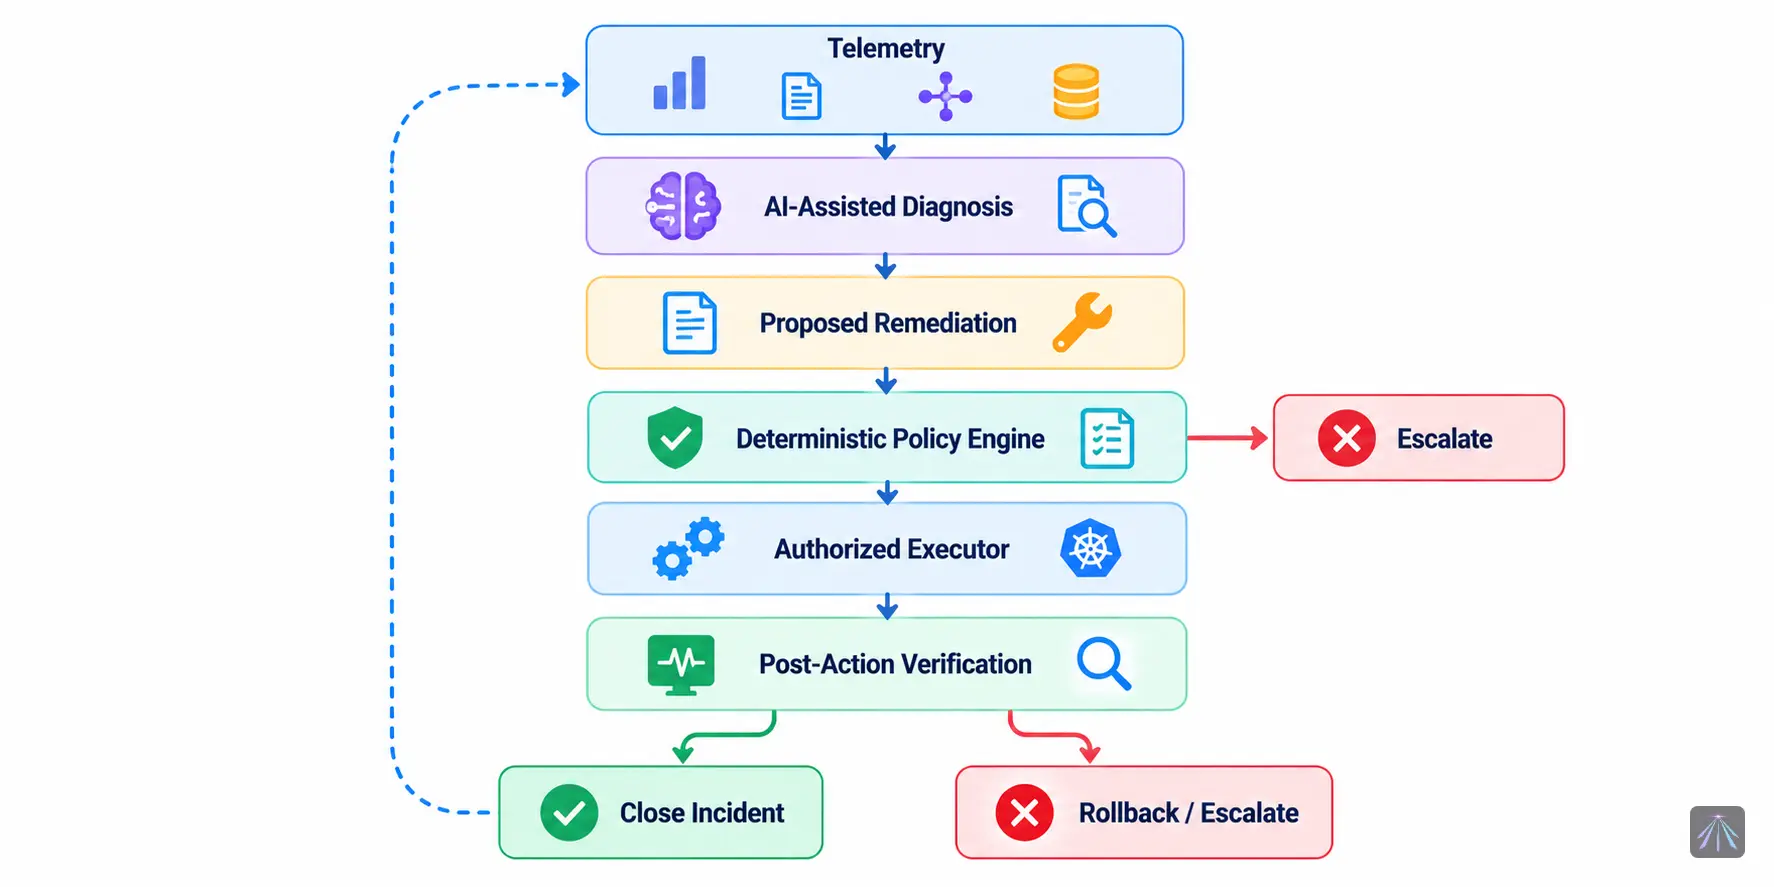
This architecture combines the contextual reasoning of AI with the predictability of policy-driven automation.
The agent should not be able to bypass permissions, expand its own privileges, or modify the safety policies that govern its execution.
Measuring the Effectiveness of Closed-Loop Remediation
The success of remediation automation should be measured using operational outcomes, not the number of automated actions executed.
Useful metrics include:
| Metric | What it measures |
|---|---|
| Mean Time to Detect (MTTD) | Time required to identify an incident |
| Mean Time to Remediate (MTTR) | Time required to restore acceptable service conditions |
| Automated Remediation Rate | Percentage of eligible incidents resolved without manual execution |
| Remediation Success Rate | Percentage of actions that achieve verified recovery |
| Recurrence Rate | Percentage of remediated incidents that recur within a defined period |
| False Remediation Rate | Percentage of actions triggered by incorrect diagnoses |
| Escalation Rate | Percentage of incidents requiring human intervention |
| Change Failure Rate | Frequency of remediation actions that introduce or worsen failures |
Metrics should be segmented by incident type, service criticality, and remediation policy.
A high automation rate is not necessarily a good outcome if the system repeatedly applies ineffective fixes. Similarly, reducing MTTR is not beneficial if it increases the rate of secondary incidents.
The target is reliable, safe recovery with minimal operational intervention.
From Reactive Operations to Self-Healing Infrastructure
Closed-loop remediation represents a shift from alert-driven operations to feedback-driven operations.
Traditional monitoring tells engineers that something is wrong. Automated remediation adds the ability to act on that information. Closed-loop remediation goes one step further by verifying whether the action restored the intended state.
A production-ready implementation requires more than an AI agent connected to infrastructure APIs. It requires reliable telemetry, actionable diagnostics, version-controlled remediation policies, least-privilege execution, safety limits, and continuous verification.
This is where AIOps engineering becomes critical.
An effective AIOps technical partner can help design the observability pipeline, identify suitable automation candidates, integrate remediation with Kubernetes and cloud APIs, implement policy enforcement, and establish measurable recovery criteria. The same partner can help monitor remediation outcomes, detect recurring failures, and improve automation without compromising production stability.
The goal is not to automate every operational decision. It is to eliminate avoidable human latency from known, recoverable failures while keeping high-impact decisions controlled, auditable, and safe.

Ready to make your infrastructure more resilient? Focused AiOps helps businesses build reliable observability, intelligent automation, and self-healing systems that reduce operational overhead and accelerate incident recovery.
References and Technical Documentation
| Topic | Resource | Relevance to the article |
|---|---|---|
| Kubernetes orchestration | Kubernetes Documentation | Understand workload management, deployment operations, and automated recovery. |
| Kubernetes API | Kubernetes API Reference | Execute controlled infrastructure operations through Kubernetes APIs. |
| Deployment rollback | kubectl rollout undo | Implement rollback procedures when a deployment introduces failures. |
| Access control | Kubernetes RBAC | Apply least-privilege permissions to remediation controllers and service accounts. |
| Observability instrumentation | OpenTelemetry Documentation | Collect and export metrics, logs, and traces for incident detection and diagnosis. |
| Metrics and alerting | Prometheus Documentation | Monitor infrastructure metrics and identify operational anomalies. |
| Alert rules | Prometheus Alerting Rules | Configure threshold-based detection and alert conditions. |
| Alert routing | Prometheus Alerting Overview | Understand alert routing, grouping, inhibition, and notification management. |
| Dashboards and visualization | Grafana Documentation | Visualize system health, monitor recovery, and correlate operational signals. |
| Log aggregation | Grafana Loki Documentation | Collect and query logs to support incident diagnosis and remediation verification. |
| Log-based alerting | Loki Alerting | Explore alerting based on log queries and operational events. |
Recommended observability stack
For teams implementing closed-loop remediation, these three tools provide a useful foundation:
- Prometheus - metrics collection, querying, and alert evaluation.
- Grafana - dashboards, visualization, and correlation of operational signals.
- Grafana Loki - centralized log aggregation and querying.
Combined with OpenTelemetry for instrumentation and Kubernetes APIs for controlled execution, these tools can form part of an architecture for detecting failures, triggering approved remediation actions, and verifying recovery.
Important: Observability tools identify and expose operational conditions; they do not automatically provide a complete self-healing system. Closed-loop remediation requires an additional control layer for diagnosis, policy enforcement, authorized execution, and post-action verification.